CloudGuard’s MXDR platform is getting ready for Christmas early with its newly updated customer dashboard, offering more detailed insights into your organisation’s cybersecurity operations. I’m Liam, CloudGuard’s Platform Leader, and I’m going to walk you through some of the key changes to our MXDR platform.
Clearer overview
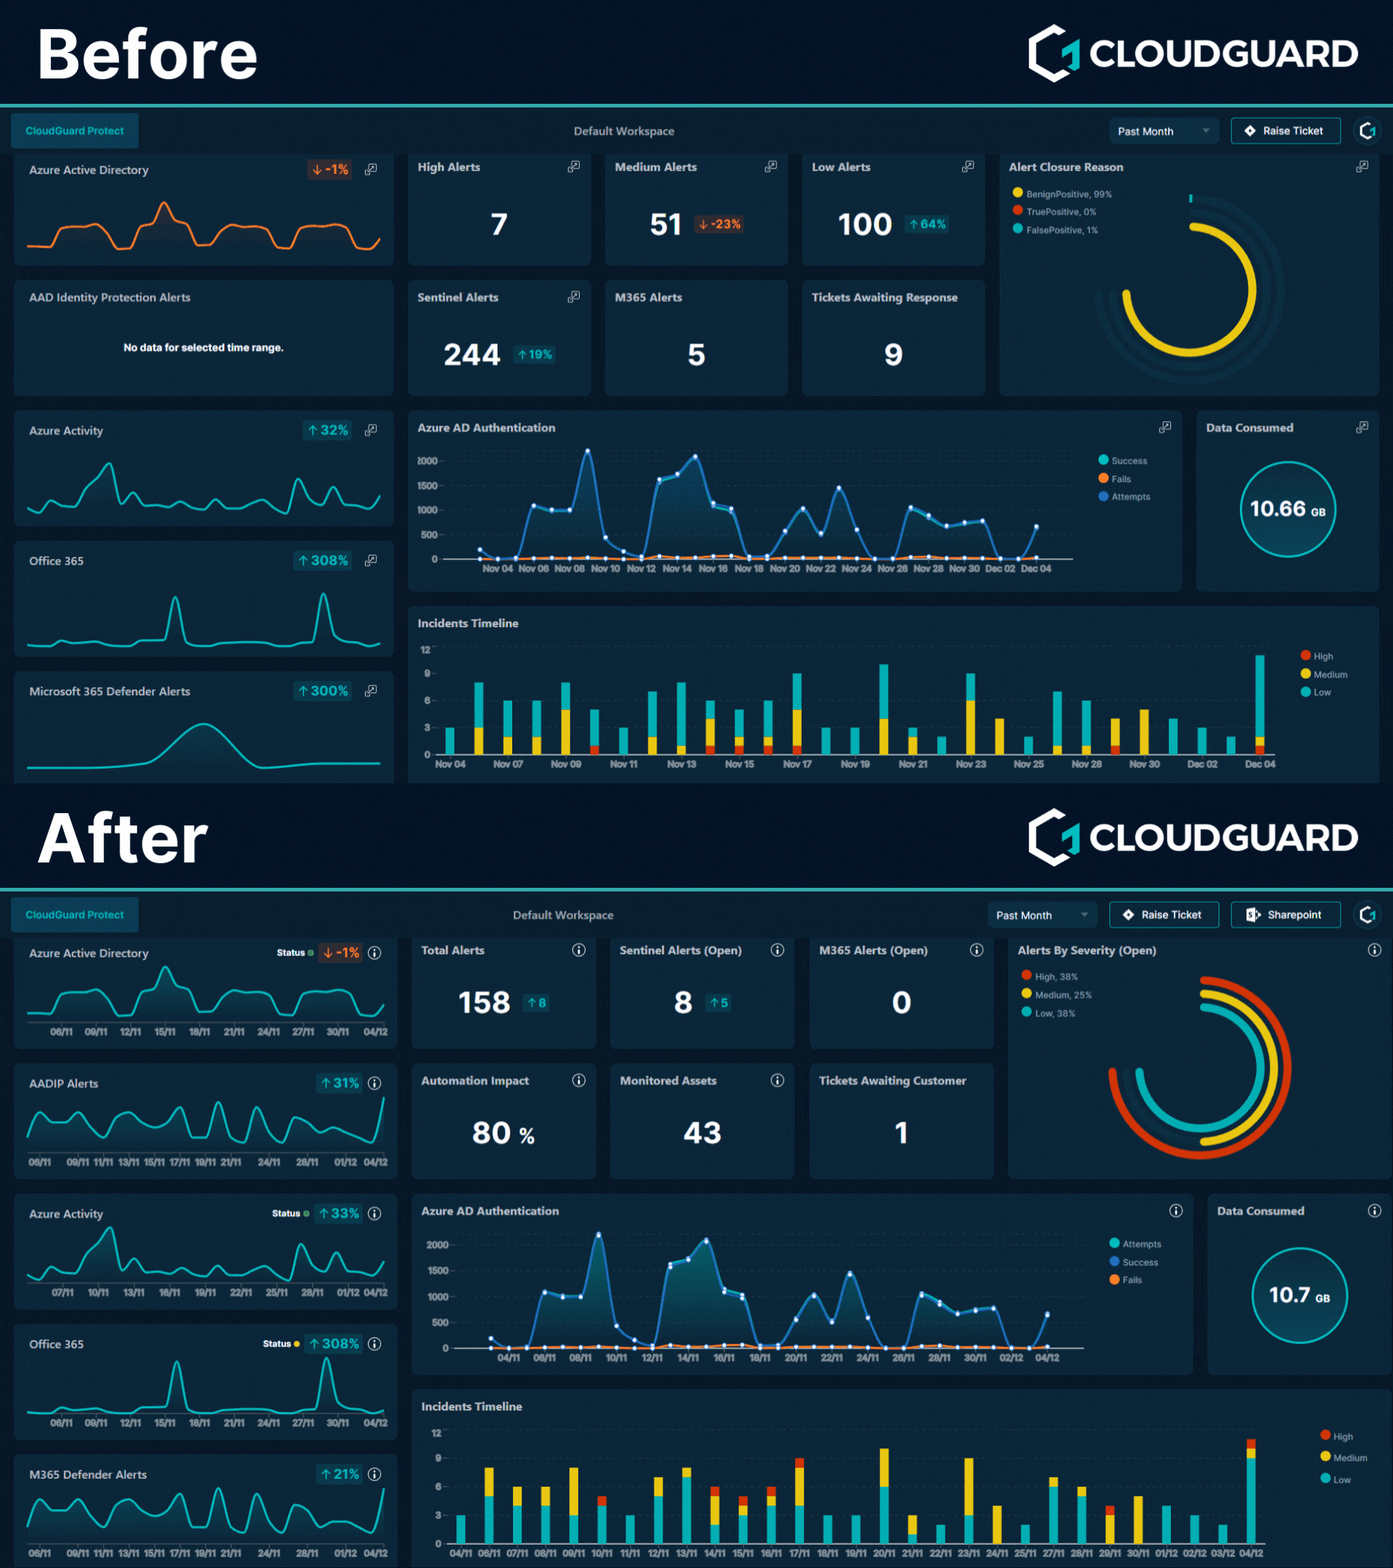
We’ve overhauled the MXDR platform’s dashboard overview – giving a clearer indication of security across your environment. Tables now have useful axis data to make it easier to track your performance. We’ve also streamlined the colour scheme to make alert severity easier to identify.
More powerful metrics
To make everything more accessible at a glance, we’ve changed some of the key metric tables regarding your environment.
- Alert Closure Reason has been removed, and replaced with Severity of Open Tickets – that’s definitely important to know
- Top 3 Metrics: Shows you the Total Amount of Alerts, and the breakdown of open alerts from Sentinel and M365
- Bottom 3 Metrics: Now shows the impact automation has on your environment, and the amount of devices monitored within Defender for Endpoint

More detailed drilldowns
We understand you want to know about incidents in your environment, so we’ve enriched the drilldown data that’s available for all alerts. This should give you a much clearer picture of what’s happening. Adding data filtering and search capabilities is our next goal.
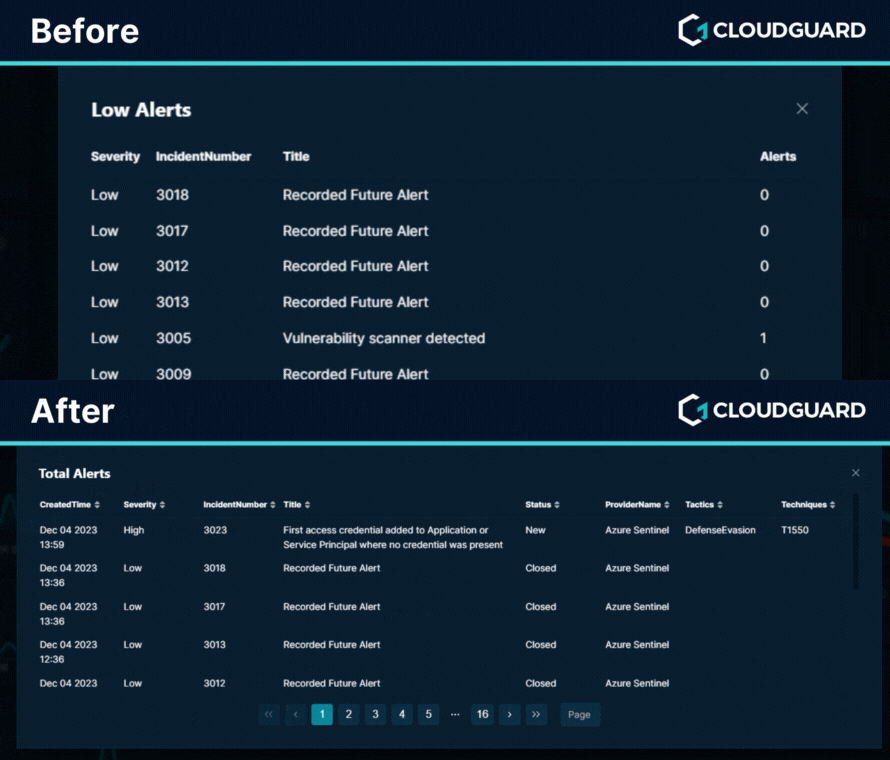
New MXDR platform metric: Automation Impact
A powerful new metric to give you an insight into the Guardian App, the impact automation is having on your environment, and your security operations as a whole. See the amount of time we’ve saved with automated threat intelligence, triaging, and resolution. You can also see the total number of tickets we’ve been able to influence with automation.
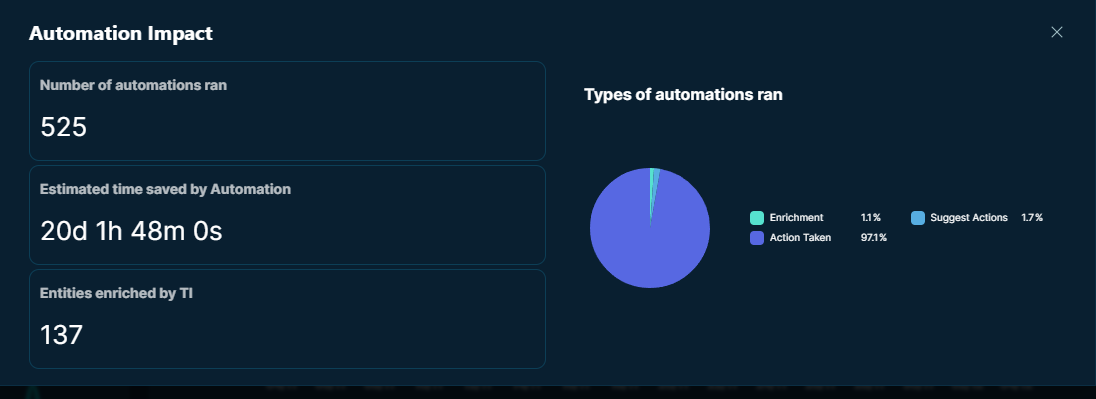
Monitored assets
It’s now easier than ever to see the assets being monitored in your environment – with helpful metrics to guide you on your risk and security.
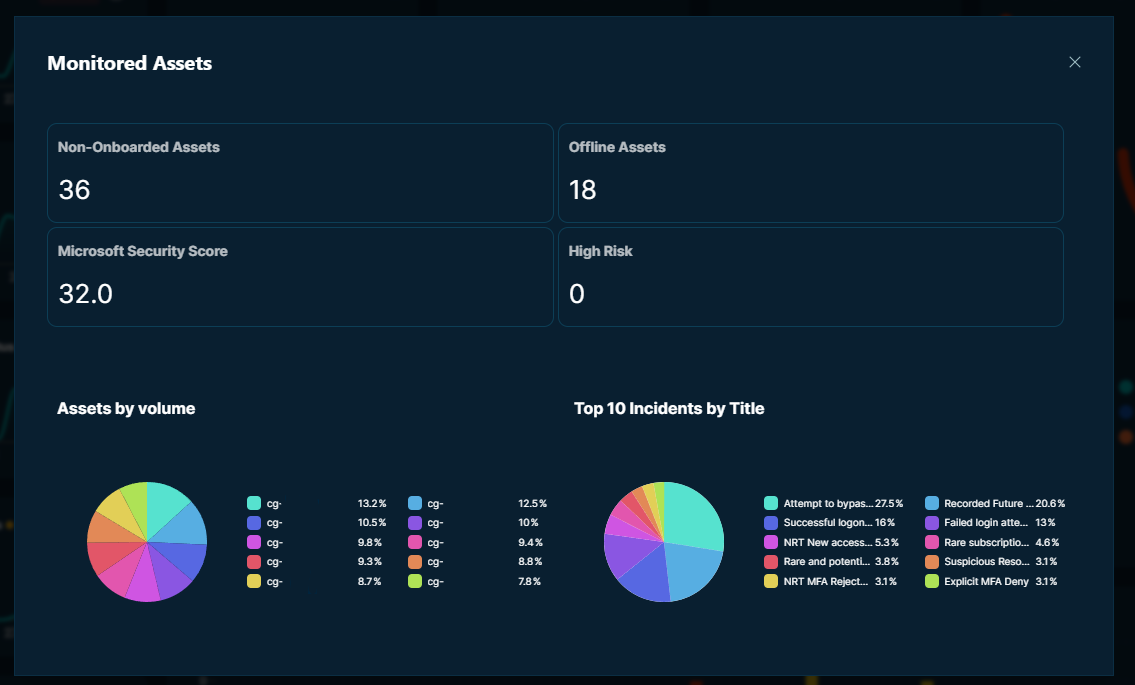
Tickets needing your attention
We’ve streamlined the process that enables you to see the tickets that need your attention. Simply click in the dashboard as below and it’ll take you to the ticketing system.
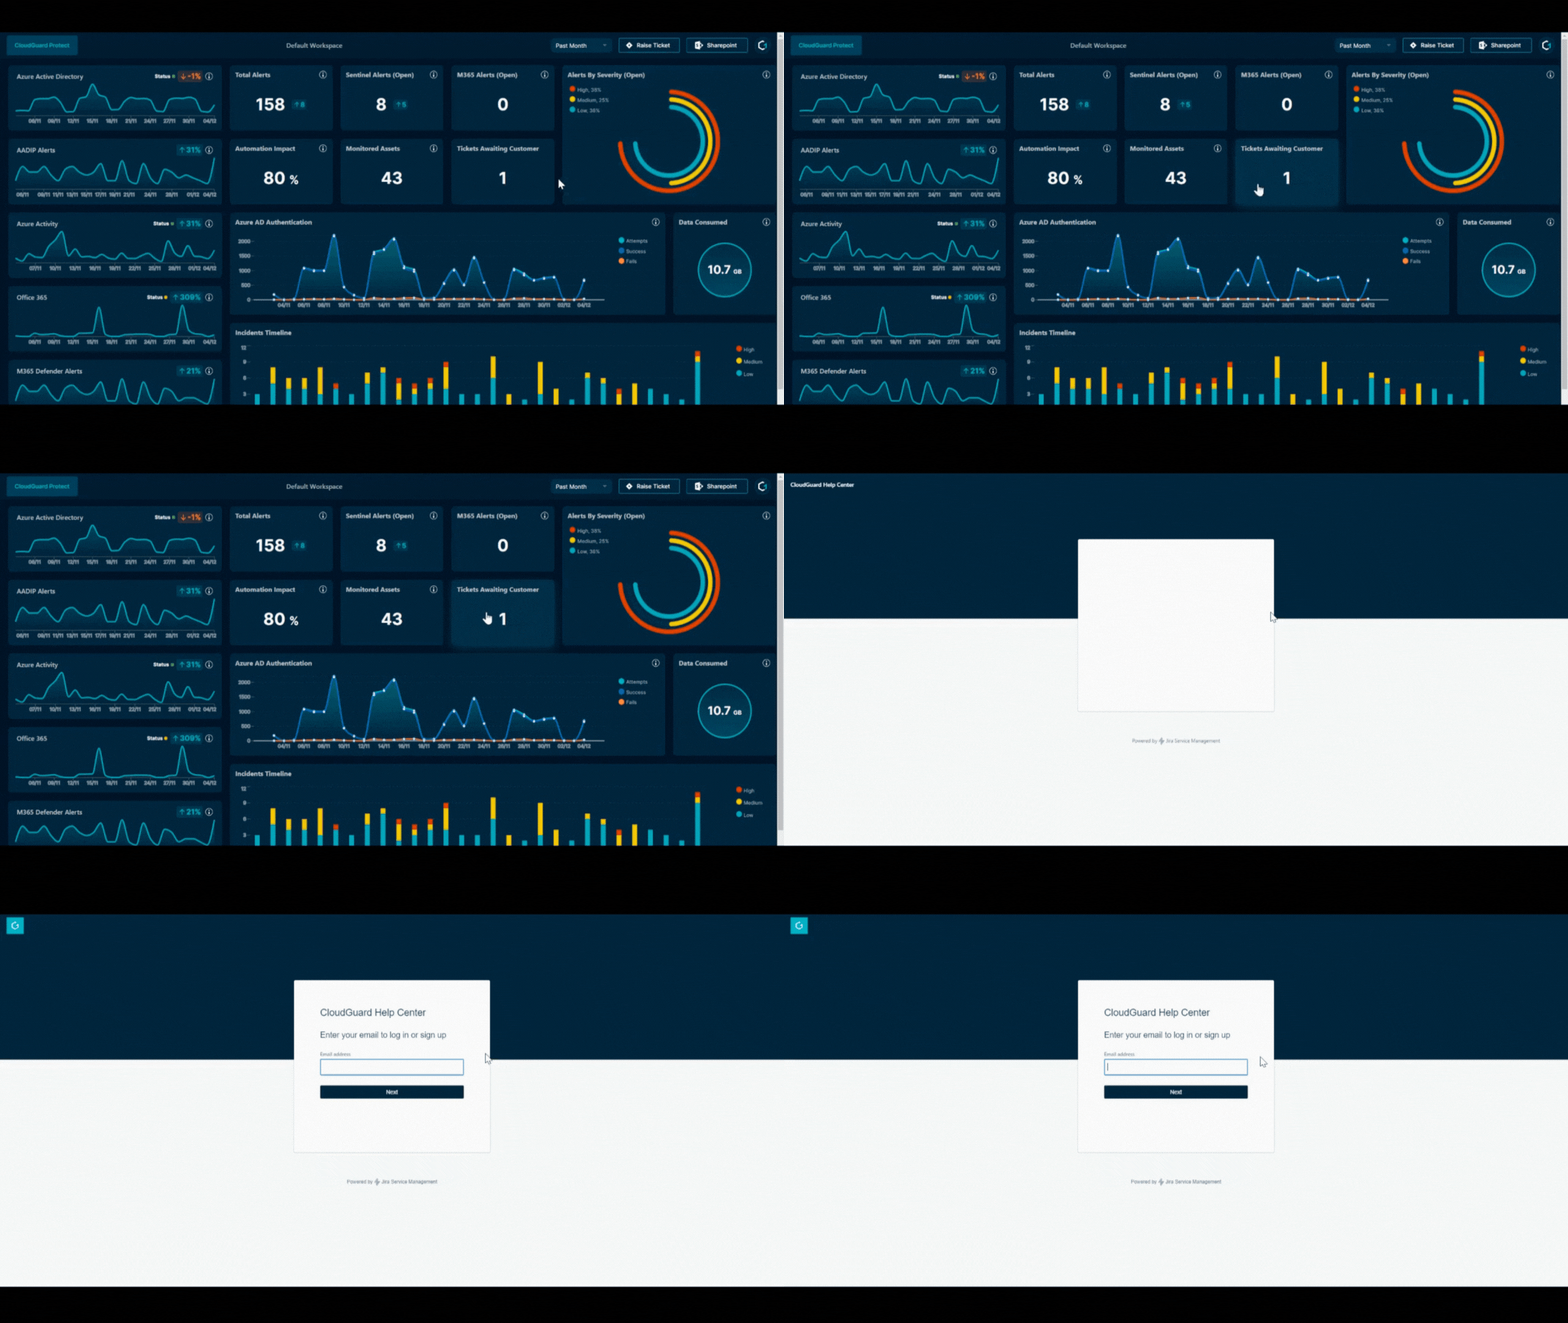
Data consumption
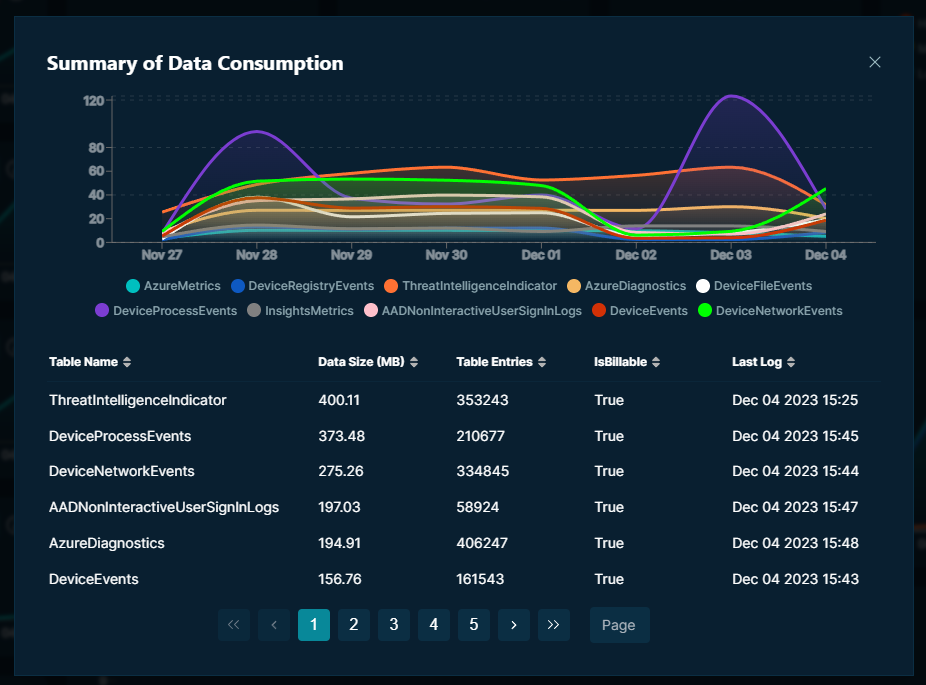
Data consumption is very a important metric when it comes to cybersecurity as it can directly impact your security costs. We’ve updated the visuals and data within the dashboard to make it much clearer to see what drives consumption in your environment.
Data connector drilldown
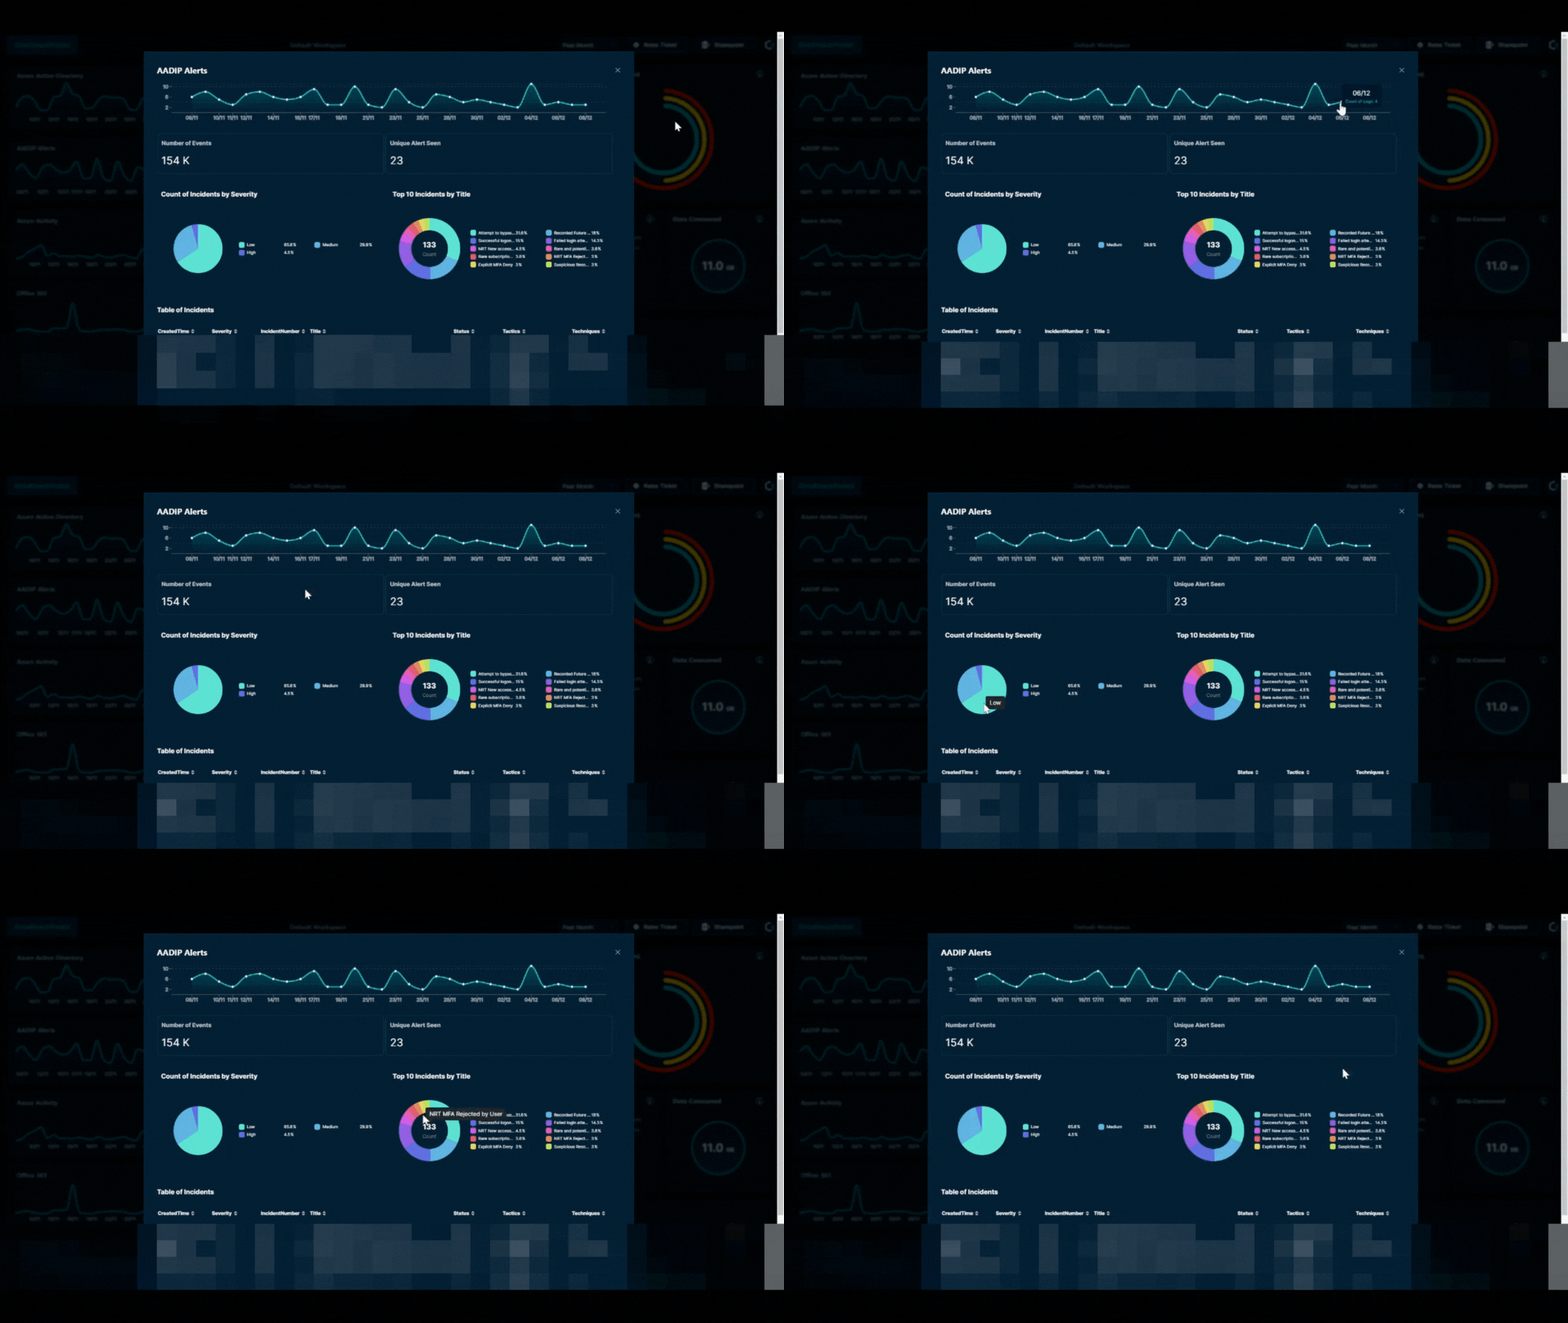
Each data connector from your environment into Microsoft Sentinel now has a detailed drilldown of data, so you can see what’s happening across multiple vectors. See the number of events and various logs, as well as other helpful metrics. Some data in the below example has been obscured for security.
Health status for connectors
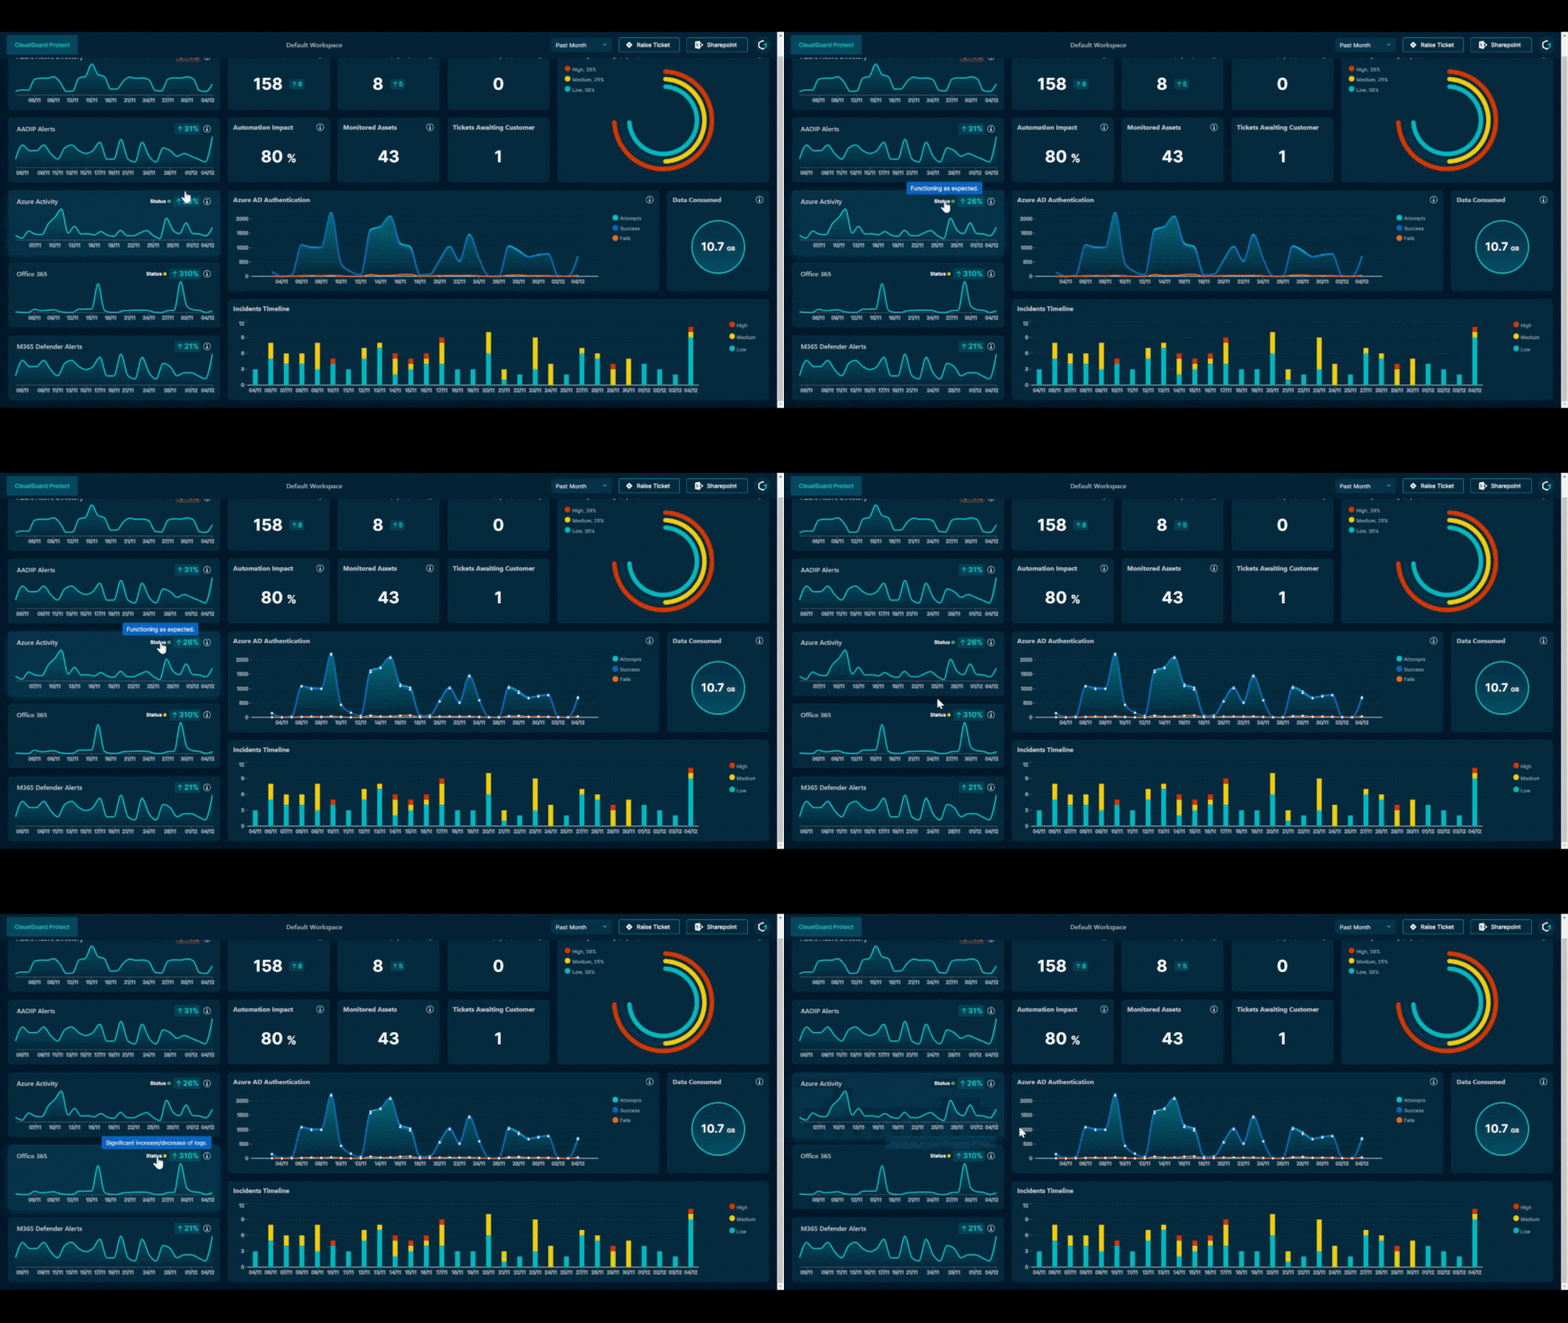
The health of your connectors is paramount when it comes to your security. We’ve made it easy to see with a scroll of a mouse, as you’ll see in the video below. It will give you more information on hover should there by anything to be concerned about.
Custom time range filter
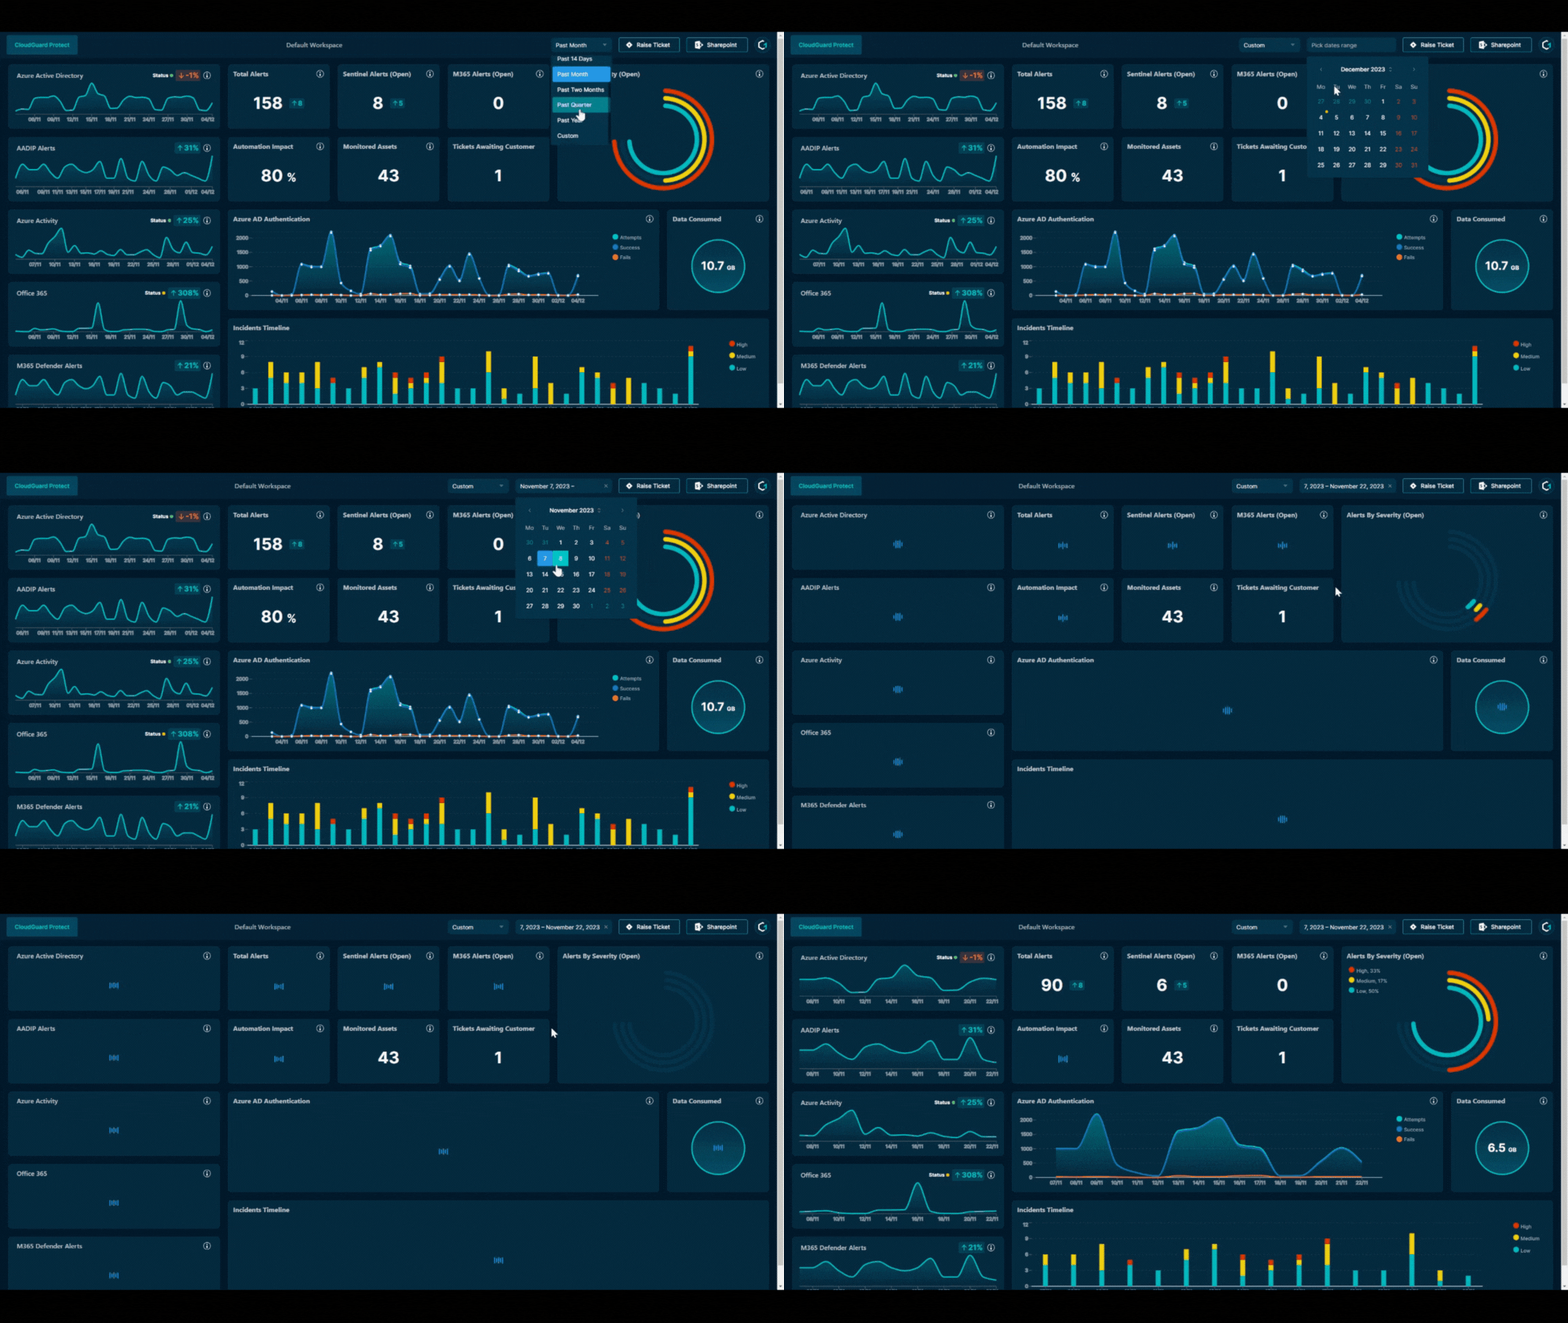
Want to review your security data over a certain time period? That’s now possible with our custom time range filter. Simply click and select the time period you want, and we’ll show you the data. Please note that the availability of historical data is dependent on your log data retention rules within Microsoft Sentinel.
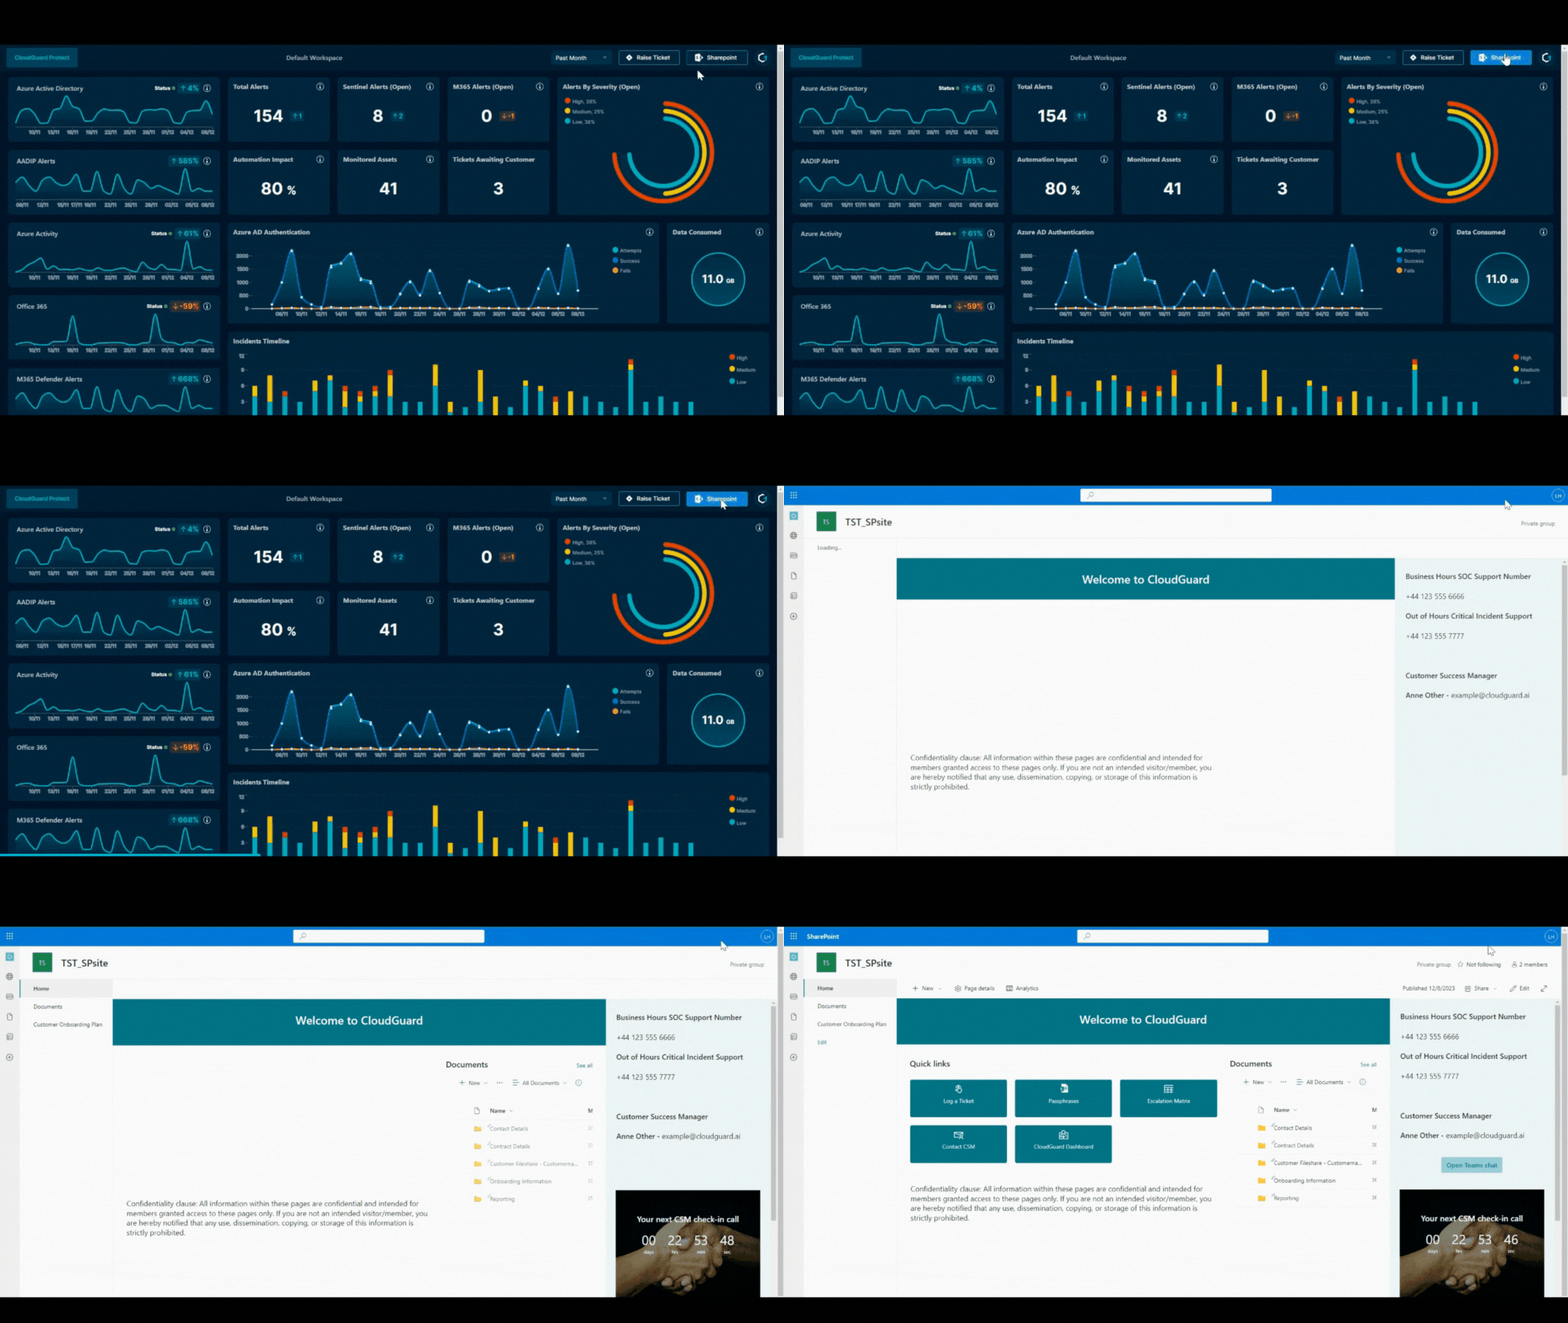
Link to SharePoint
Want to view all your customer documents related to our MXDR service? You can now click within the dashboard to be taken to your private SharePoint environment.
That’s all, folks
And that’s it for now on the new features in our MXDR platform customer dashboard. Our engineers are already working on the next phase of enhancements, and I look forward to sharing the updates with you in the future. Do you have any feature requests or questions? Email me on [email protected].
